Congress and Election Data
Goal
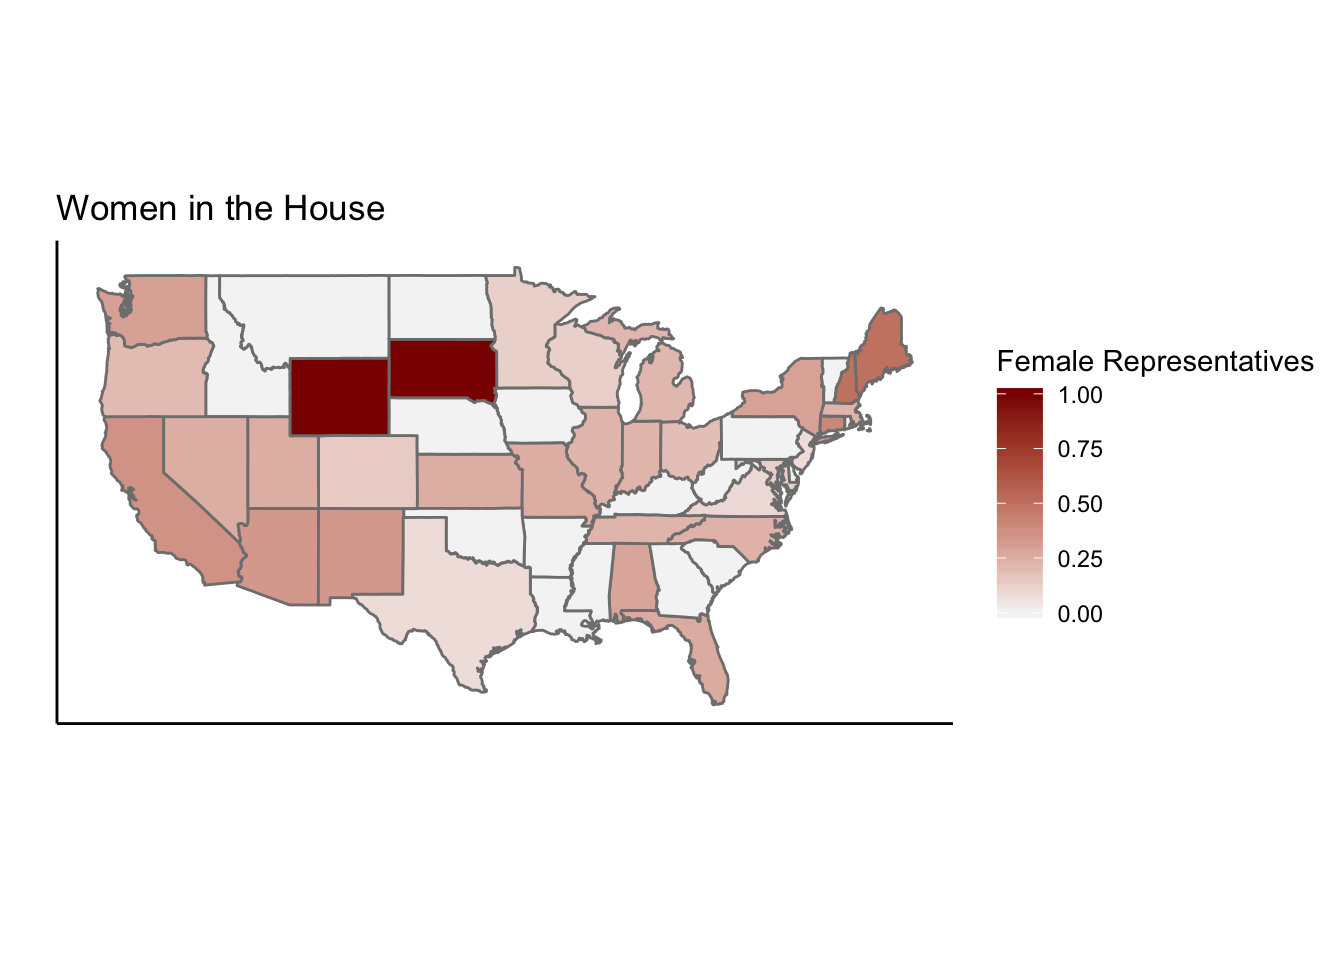
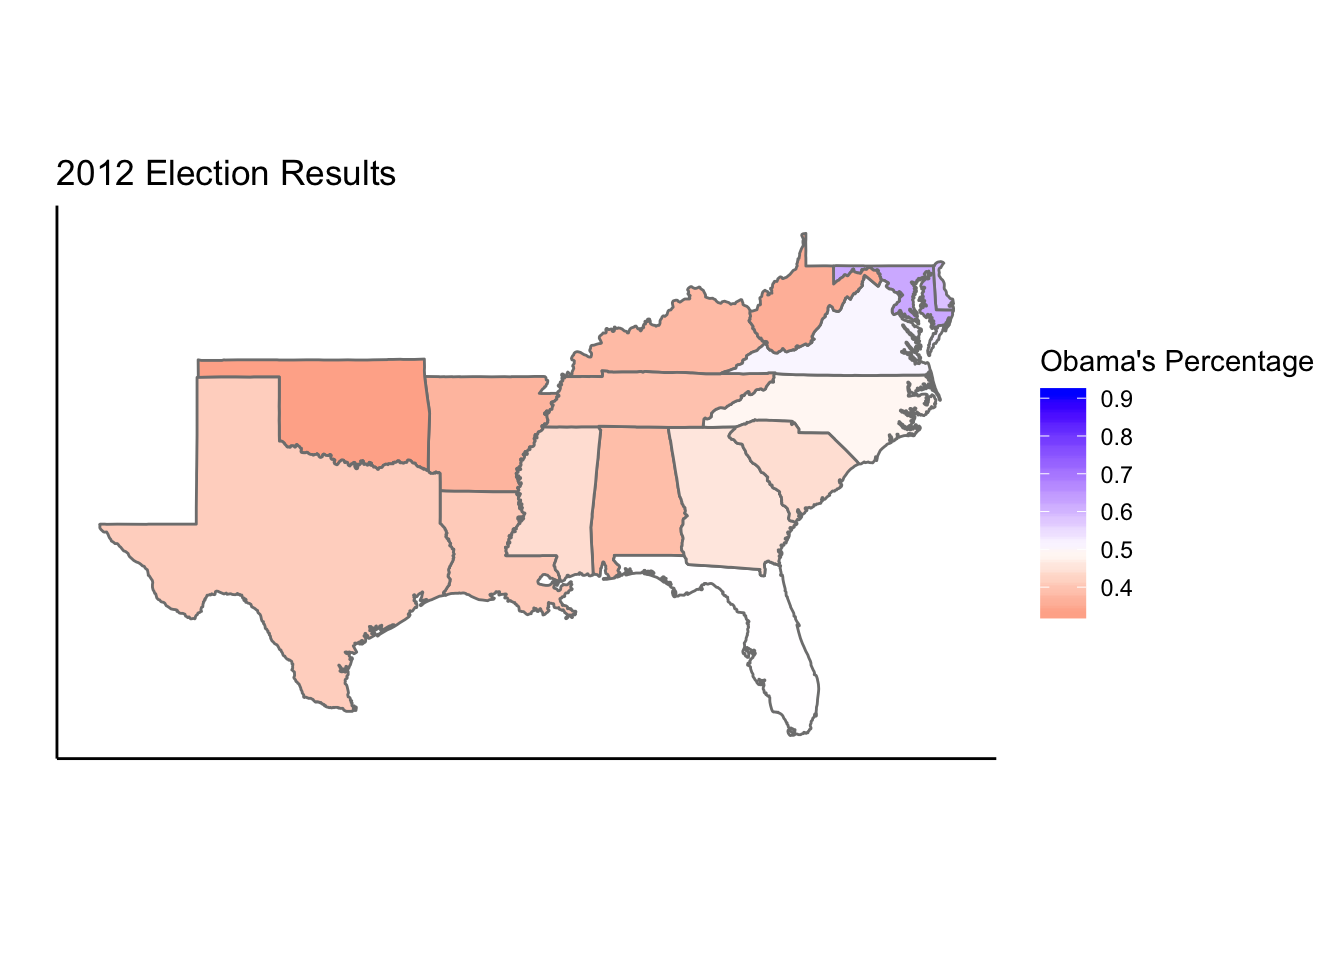
My goal was to determine if there is a correlation between women representatives in the House and the elections results of 2012. These chloropleths accurately show both of these goals, but does not show much of a correlation.
Data
The state data comes from the r package entitled tidyverse by using the command all_states <- map_data(“state”). The womenincongress.csv comes from my Data Visualization class.
congress <- summarize(group_by(congress,region,representatives,total),
                  redProp=representatives/total)

stateData = mutate(stateData,redProp=representatives/total)

housePlot <- ggplot()+geom_polygon(data=stateData,aes(x=long,
                                                      y=lat,
                                                      group = group,
                                                      fill=redProp),
                                   color="grey50")+
  coord_map()+
  labs(x="",y="",title="Women in the House")+
  theme_classic()+
  theme(axis.ticks.y = element_blank(),
        axis.text.y = element_blank(),
        axis.ticks.x = element_blank(),
        axis.text.x = element_blank())
housePlot <- housePlot + scale_fill_gradient(name="Female Representatives",low="whitesmoke",high="darkred")
housePlot
Graph 1: This graph show the proportion of female House of Representatives per state in the US. In order to get the proportion of women in the house, I had to use the summarize function to divide the number of women by the total representatives per state.
electionData <- read_csv("2012.csv")## Warning: Missing column names filled in: 'X1' [1]## Parsed with column specification:
## cols(
## X1 = col_character(),
## ObamaVotes = col_double(),
## ObamaEV = col_double(),
## RomneyVotes = col_double(),
## RomneyEV = col_double(),
## JohnsonVotes = col_double(),
## JohnsonEV = col_double(),
## SteinVotes = col_double(),
## SteinEV = col_double()
## )names(electionData)[1] <- "region"
electionData$ObamaPerc <- electionData$ObamaVotes/(electionData$ObamaVotes+electionData$RomneyVotes+electionData$JohnsonVotes+electionData$SteinVotes)
electionData$RomneyPerc <- electionData$RomneyVotes/(electionData$ObamaVotes+electionData$RomneyVotes+electionData$JohnsonVotes+electionData$SteinVotes)
electionData <- merge(all_states,electionData,by="region")
south_states <- c("Delaware", "Florida", "Georgia", "Maryland", "North Carolina", "South Carolina", "Virginia", "District of Columbia", "West Virginia", "Alabama", "Kentucky", "Mississippi", "Tennessee", "Arkansas", "Louisiana", "Oklahoma", "Texas")
south_states <- tolower(south_states)
south_data <- filter(electionData, region %in% south_states)
south_election_plot <- ggplot()+
geom_polygon(data=south_data,aes(x=long,
y=lat,
group = group, fill=ObamaPerc),color="grey50")+
coord_map()+
labs(x="",y="",title="2012 Election Results")+
theme_classic()+
theme(axis.ticks.y = element_blank(),
axis.text.y = element_blank(),
axis.ticks.x = element_blank(),
axis.text.x = element_blank()) +
scale_fill_gradient2(name="Obama's Percentage",
low="red",
mid="white",
high="blue",
midpoint=.5)
south_election_plot
Graph 2: This graph shows the percentage of people who voted for President Obama in the southern states. In order to get just the southern states, I had to make a variable to hold the list of southern states and filter the dataset to be just for these states. I also had to merge the state data with the election results in order to have a dataset with the comprehensive information necessary.
Conclusions
People in the southern states voted less for Obama than those in Maryland and potentially the northern states. While we cannot draw conclusions about the northern states, we can only assume they voted more heavily for Obama than the southern states did. There are only two states that have all women in the house: Wyoming and South Dakota.